An agent that picks the wrong tool doesn’t crash. Instead, it just gives you a confidently wrong answer, and the logs look fine. That’s the core failure mode that makes agentic systems hard to operate: the model didn’t error out it simply called search_flights when it should have called search_hotels, and nothing downstream noticed. As Groundcover’s engineering team puts it, because agents are non-deterministic, replaying the same input twice may not even follow the same path. Because of this, you need a concrete, per-request record of what actually happened, rather than a guess based on aggregate metrics.
That record is a trace: the connected sequence of every LLM call, tool invocation, and handoff an agent makes on a single run. In other words, if you want to trace AI agent tool calls in production, you need visibility into that entire chain, not just the final output. This guide covers how tool call tracing actually works under the hood the span structure, the OpenTelemetry conventions now standardizing it, and how to choose between LangSmith, Langfuse, MLflow, and the rest based on your stack rather than a feature checklist alone.
Key takeaways:
- A trace is the full record of an agent run every LLM call, tool invocation, and handoff, nested as parent-and-child spans.
- Tool call tracing specifically records which tool a model chose, what arguments it passed, and what came back.
- OpenTelemetry’s
gen_ai.*semantic conventions are becoming the industry-standard way to structure this data across vendors. - LangSmith, Langfuse, MLflow, Comet Opik, Sentry, and Datadog all support tool-call-level tracing, but differ in framework lock-in and openness.
- The fastest way to debug a misbehaving agent is to inspect the
execute_toolspan, not the final answer.
What Is Tool Call Tracing?
Tool call tracing is the practice of recording every tool a model invokes during an agent run as a structured span capturing which tool was called, what arguments it received, what result came back, and how long it took. It’s a subset of the broader discipline of agent observability, which Langfuse defines as capturing every step an agent takes LLM calls, tool invocations, retrievals, and control-flow decisions as structured traces you can inspect and evaluate.
The distinction matters, because LLM observability and agent observability solve different problems. LLM observability tracks a single completion: prompt in, tokens out. Agent observability, on the other hand, stitches many of those completions together with every tool invocation into one connected execution graph. As a result, that graph is where multi-step failures actually hide, and it’s also where session-level tracing and root-cause analysis have to happen.
How Does Tool Call Tracing Work?
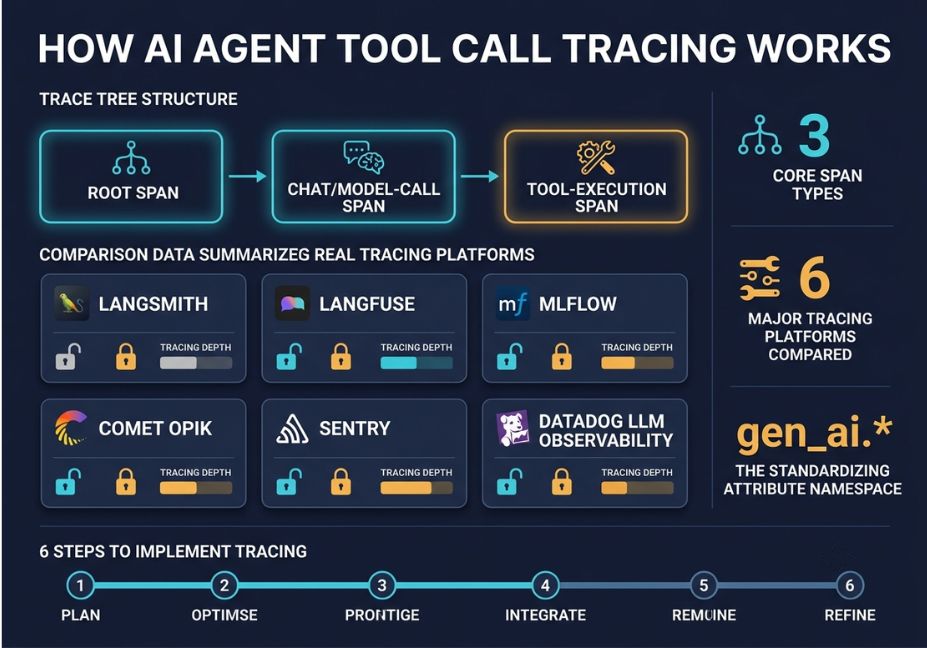
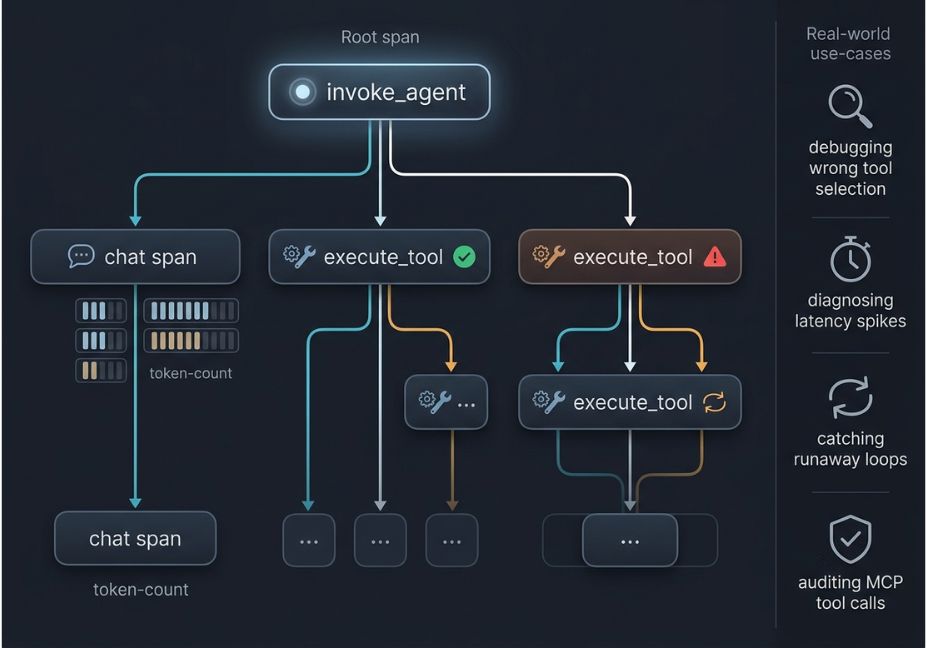
Every agent run is really a tree, not a line. For example, Sentry describes agent tracing as following a single run start-to-finish as a connected trace, with every LLM call, tool execution, and handoff represented as its own span carrying inputs, outputs, token counts, cost, and timing.
Specifically, three span types show up in almost every agent trace:
- Root span (
invoke_agent) the entire run, start to finish - Chat span each individual model call, with prompt, completion, and token usage attached
- Tool span (
execute_tool) each tool invocation, with the tool name, the arguments the model passed, and the raw result
This structure isn’t arbitrary it’s converging on a standard. OpenTelemetry’s semantic conventions for generative AI, governed under the Cloud Native Computing Foundation (CNCF), define a gen_ai.* attribute namespace that fixes span names like invoke_agent, chat, and execute_tool. Because of this shared vocabulary, a tool call looks the same regardless of which framework emitted it. Datadog, Honeycomb, New Relic, and Grafana Tempo already ingest this schema natively, while frameworks including LangChain, CrewAI, and AutoGen now emit OTel-compliant spans directly or through instrumentation packages. Even Anthropic’s Claude Agent SDK and Weights & Biases Weave follow the same span-based model for tracking parent-and-child agent calls.
Technical Note: The reasoning-and-acting pattern most tool-calling agents follow traces back to the ReAct paper’s reasoning-and-acting loop think, act, observe, repeat. Consequently, almost every trace viewer renders agent runs as an alternating sequence of reasoning steps and tool spans rather than a flat call log.
Tool Trace AI Use Cases 4 Real-World Examples
1. Debugging a wrong-tool selection. An agent has both search_flights and search_hotels available and picks the wrong one. Even so, the final answer still reads plausibly. Only the execute_tool span showing which tool name and arguments the model actually sent reveals the misfire. This is essentially how to debug AI agent tool selection errors without guessing.
2. Diagnosing latency spikes. Similarly, MLflow’s automatic tracing captures the full directed acyclic graph of an agent run, including parallel tool calls and conditional branches. As a result, a slow response can be attributed to a specific tool call rather than a vague “the model was slow.”
3. Catching runaway loops. For instance, a retry loop that keeps re-calling the same tool with slightly different arguments burns tokens and money silently. Per-span token usage and a rising gen_ai.usage.output_tokens count are the earliest signal which is also how teams reduce AI agent token costs with tracing before a bill spikes.
4. Auditing MCP tool calls. Meanwhile, Sentry now provides observability for Model Context Protocol (MCP) servers specifically tracking tool calls, errors, latency, and usage, and stitching them into the same trace as the agent and LLM spans that called them.
Did You Know? Coding agents including GitHub Copilot, Codex, and Claude Code now emit OpenTelemetry traces directly using the GenAI conventions, meaning their tool-call behavior is readable in any OTLP-compatible backend without custom instrumentation.
Best Tools for Tracing AI Agent Tool Calls
Comet’s 2026 observability roundup groups the category into five shapes: full-lifecycle platforms, evaluation-first tools, production monitoring layers, enterprise control planes, and extensions of broader platforms. Here’s how the major options map to that:
| Tool | Best for | Tool-call tracing depth | Open source |
|---|---|---|---|
| LangSmith | LangChain/LangGraph-native teams | Full execution tree, reasoning + tool calls | No |
| Langfuse | Framework-agnostic, self-hosted teams | Typed observations, tool-call analytics, agent graph view | Yes |
| MLflow | Teams already on MLflow for model tracking | Full DAG incl. parallel/conditional tool calls | Yes |
| Comet Opik | Apache 2.0 open-source, eval-first workflows | Span-level evaluation on tool spans | Yes |
| Sentry | Teams wanting tracing + error alerting together | Tool execution as spans inside app-wide traces | Partial |
| Datadog LLM Observability | Orgs already standardized on Datadog/OTel | Native GenAI semantic convention ingestion | No |
Pro Tip: If you’re not locked into a framework yet, start with whatever emits OpenTelemetry gen_ai.* spans natively. It’s the only choice that doesn’t lock your trace data to one vendor’s schema later.
Step-by-Step: How to Implement Tool Call Tracing
- Add an OpenTelemetry SDK to your agent process the Node or Python SDK plus an OTLP exporter, configured as early in the process lifecycle as possible.
- Add auto-instrumentation for your LLM client (OpenAI, Anthropic, etc.) so you get chat spans with token usage and model metadata for free, before writing custom code.
- Wrap the top-level run in an
invoke_agentspan this becomes the root of the trace tree everything else nests under. - Wrap each tool function in an
execute_toolspan, recording the tool name, sanitized arguments, and outcome status. - Propagate trace context across every tool call and sub-agent handoff so one user request stays inside a single trace, from planner to specialist to any external API it touches.
- Send spans to a backend that speaks OTLP Langfuse, MLflow, Datadog, or any GenAI-convention-compatible tool and start with automatic instrumentation before adding custom attributes.
python
from opentelemetry import trace

tracer = trace.get_tracer("agent-service")

def run_agent(user_input: str):
    with tracer.start_as_current_span("invoke_agent") as agent_span:
        agent_span.set_attribute("gen_ai.agent.name", "support-agent")
        plan = call_model(user_input)  # emits its own "chat" span
        for tool_call in plan.tool_calls:
            with tracer.start_as_current_span("execute_tool") as tool_span:
                tool_span.set_attribute("gen_ai.tool.name", tool_call.name)
                result = run_tool(tool_call.name, tool_call.arguments)
                tool_span.set_attribute("gen_ai.tool.call.result.status", result.status)
    return plan
Technical Disclaimer: The gen_ai.* attribute names above follow the OpenTelemetry GenAI semantic conventions as of mid-2026; the spec is still under active development between minor versions, so check the OTel semantic-conventions repository for the current attribute set before shipping this to production.
Common Mistakes and How to Avoid Them
- Logging everything on day one. Groundcover’s guidance here is blunt: start with automatic instrumentation and a small set of important workflows, then add custom spans only where you actually need more detail to debug.
- Losing trace context across handoffs. Otherwise, multi-agent systems fail silently when a sub-agent call isn’t nested inside the parent trace you end up with disconnected fragments instead of one readable tree.
- Treating tool-call arguments as opaque. If you don’t capture what arguments the model actually passed to a tool, you can’t tell a bad tool from a bad prompt.
- Ignoring token cost per span. A single looping tool call can quietly dominate your bill; therefore, per-span token and cost attribution catches this before the monthly invoice does.
- Skipping MCP-specific instrumentation. If your agent calls tools through MCP servers, they need their own tracing, since generic HTTP spans won’t capture tool-selection behavior.
What Developers Are Saying
Threads on r/LocalLLaMA and GitHub Discussions around agent frameworks return to the same complaint: most observability tools show what happened but not why a tool was chosen over an equally valid alternative which is pushing teams toward span-level evaluation scores attached directly to tool-call spans, rather than pass/fail checks on the final output alone.
FAQ People Also Ask
What is tool call tracing in AI agents?
Tool call tracing records every tool invocation an agent makes during a run as a structured span capturing the tool name, the arguments passed, the result, and timing nested inside the broader trace of the agent’s execution.
How is agent tracing different from LLM tracing?
LLM tracing covers a single model call: prompt, completion, tokens. Agent tracing connects many of those calls plus every tool invocation into one execution graph, which is where multi-step failures typically hide.
What’s the difference between LangSmith and Langfuse?
LangSmith is tightly integrated with LangChain and LangGraph and is closed-source; Langfuse is framework-agnostic and open-source, exposing typed observations and agent graph visualization you can self-host.
Can you trace Model Context Protocol (MCP) tool calls?
Yes. Platforms like Sentry now instrument MCP servers directly, tracking tool calls, latency, and errors, and connecting them into the same trace as the agent and LLM spans that invoked them.
Do I need OpenTelemetry to trace an AI agent?
Not strictly, but it’s becoming the default. The gen_ai.* semantic conventions let a tool call look identical regardless of framework or model provider, which is what makes cross-vendor agent observability possible at all.
How do you debug AI agent tool calls?
Open the trace for the failing run and inspect the execute_tool span rather than the final answer. It shows exactly which tool the model chose, what arguments it passed, and what result came back, which is usually where the actual failure is hiding.
How much does it cost to add tracing to an AI agent?
Most platforms including Langfuse, MLflow, and Comet Opik offer free open-source or free-tier options, so the main cost is engineering time to instrument the agent, not licensing. Instrumentation typically takes a few hours using auto-instrumentation libraries before any custom spans are added.
Conclusion
In short, tool call tracing turns an agent’s black-box run into a readable tree: which tool it picked, what it sent, what came back, and where the time and tokens went. Whether you build on LangSmith, Langfuse, MLflow, or raw OpenTelemetry, the underlying structure is the same an invoke_agent root span with chat and execute_tool spans nested inside it. Ultimately, once that structure is instrumented early, debugging a misfired tool call stops being a guessing game.
Bookmark this guide and explore more hands-on agentic workflow tutorials at agentiveaiagents.com.