
Most AI agents don’t fail because the underlying model is weak. Instead, they fail quietly, burning tokens on redundant tool calls and retries that nobody notices until the bill arrives. Efficiency tracking using AI tools has therefore become the missing layer in most agent stacks. Teams typically instrument for correctness does the agent get the right answer? but skip instrumentation for efficiency: how many tool calls, tokens, and seconds it cost to get there. As a result, the gap shows up first in the orchestration layer, where a single planning loop can silently double its token usage between deployments.
In other words, this isn’t a productivity-app problem. It’s a tracing problem. If you’re wondering how to track AI agent efficiency in production, the tools that actually move the needle are agent observability platforms, and the underlying technique borrows directly from the tool-use loop popularized in the ReAct paper that formalized interleaved reasoning and acting. Once you can see every step an agent takes, efficiency stops being a guess. It becomes a metric you can graph, alert on, and optimize.
Quick answer: Efficiency tracking using AI tools means instrumenting an agent’s tool-use loop with trace data tokens, latency, and tool calls so cost-per-task can be measured the same way accuracy is measured.
What Is Efficiency Tracking for AI Agents?
Efficiency tracking for AI agents is the practice of measuring the operational cost of an agent’s tool-use loop tokens consumed, latency per step, tool-call count, and cost-per-task using trace instrumentation rather than manual review. In short, it extends standard agent observability beyond correctness checks into resource accounting.
However, this differs from traditional application performance monitoring, which watches CPU and memory. Efficiency tracking for agents instead watches non-deterministic decision paths: how many retrieval calls a RAG step made, whether the planner looped unnecessarily, and how token usage compares across model versions. To standardize this, OpenTelemetry’s GenAI semantic conventions now define a common schema for this kind of span data, so different observability platforms can compare notes on the same trace which is exactly why teams researching the best AI agent observability tools for efficiency tracking tend to start there.
How Does Efficiency Tracking Work?
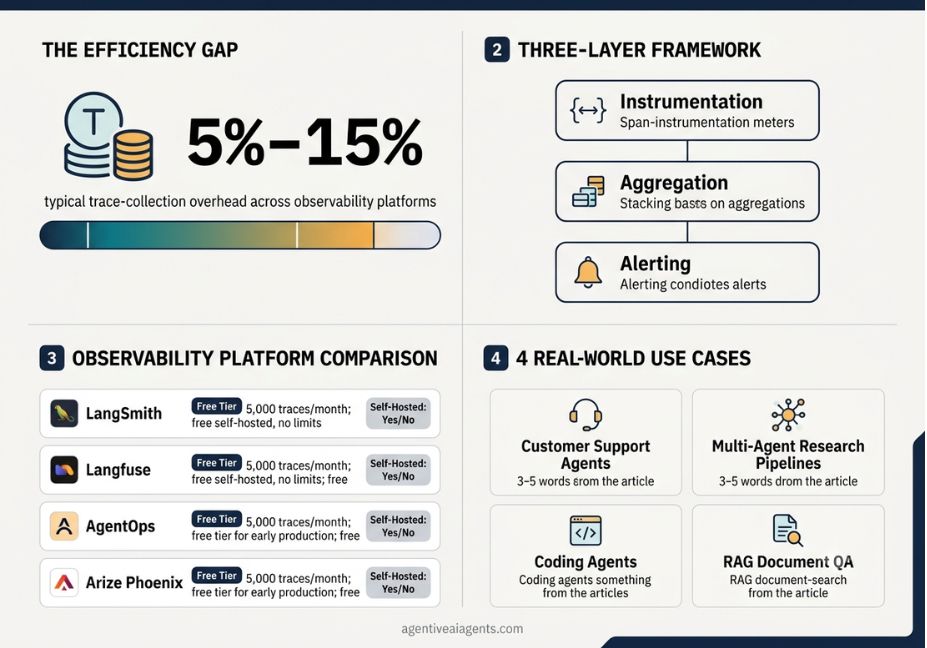
Broadly speaking, efficiency tracking runs on three layers: instrumentation, aggregation, and alerting.
- First, instrumentation every LLM call, tool invocation, and retrieval step is wrapped in a span that records latency, token counts, and outcome.
- Next, aggregation traces roll up into per-task and per-session metrics: total tokens, wall-clock time, cost, and step count.
- Finally, alerting thresholds flag regressions, such as a planner suddenly needing three extra tool calls to complete the same task.
Architect’s Note: Treat efficiency metrics as a first-class evaluation dimension alongside accuracy. A 95%-accurate agent that costs four times more per task than a 92%-accurate one is often the worse production choice.
Here’s a minimal example instrumenting a tool-use loop with OpenTelemetry-style spans:
python
from opentelemetry import trace

tracer = trace.get_tracer("agent.efficiency")

def run_agent_step(step_name, fn, *args):
    with tracer.start_as_current_span(step_name) as span:
        result = fn(*args)
        span.set_attribute("gen_ai.usage.output_tokens", result.usage.output_tokens)
        span.set_attribute("tool_call.count", result.tool_calls)
        return result
Each span becomes a row in your efficiency dashboard, letting you filter by task type, model version, or agent branch.
Efficiency Tracking Use Cases 4 Real-World Examples
- Customer support agents: flagging sessions where the agent re-queries the knowledge base more than twice for the same intent, a signal of poor retrieval accuracy.
- Multi-agent research pipelines: tracking token cost per sub-agent to find which one dominates spend in an orchestration layer.
- Coding agents: measuring time-to-first-token and total wall-clock time per pull request generated.
- RAG-based document QA: correlating chunking strategy changes with retrieval latency and answer quality, so a smaller context window doesn’t quietly hurt accuracy.
Did You Know? Independent benchmarking of agent observability platforms found trace-collection overhead ranging from roughly 5% to 15% of total run time depending on the tool and how much detail each trace captures a real cost worth measuring before you standardize on a platform.
Best Tools and Frameworks for Efficiency Tracking
Now that you understand how the instrumentation layer works, here’s how the leading platforms compare on the metrics that matter for efficiency tracking specifically.
| Tool | Best for | Self-hosting | Free tier |
|---|---|---|---|
| LangSmith | Deep LangChain/LangGraph tracing, low overhead | No | 5,000 traces/month |
| Langfuse | Open-source, self-hosted deployments with data residency needs | Yes | Free, no usage limits (self-hosted) |
| AgentOps | Multi-agent session replay and behavioral-deviation detection | No | Free tier for early production |
| Arize Phoenix | Fully open-source evaluation and tracing | Yes | Free |
Pro Tip: If your team is still deciding on a stack, start with whichever tool has the lowest integration cost for your existing framework switching trace formats later is far more expensive than switching dashboards.
Beyond these four, general-purpose observability vendors are also entering the space: Datadog LLM Observability extends existing APM stacks to GenAI spans, and Helicone offers a low-latency proxy for teams that want tracing without changing much code. Meanwhile, model providers such as OpenAI and Anthropic publish their own usage and token-accounting APIs, which can serve as a lightweight starting point before adopting a dedicated observability platform.
Step-by-Step: How to Implement Efficiency Tracking
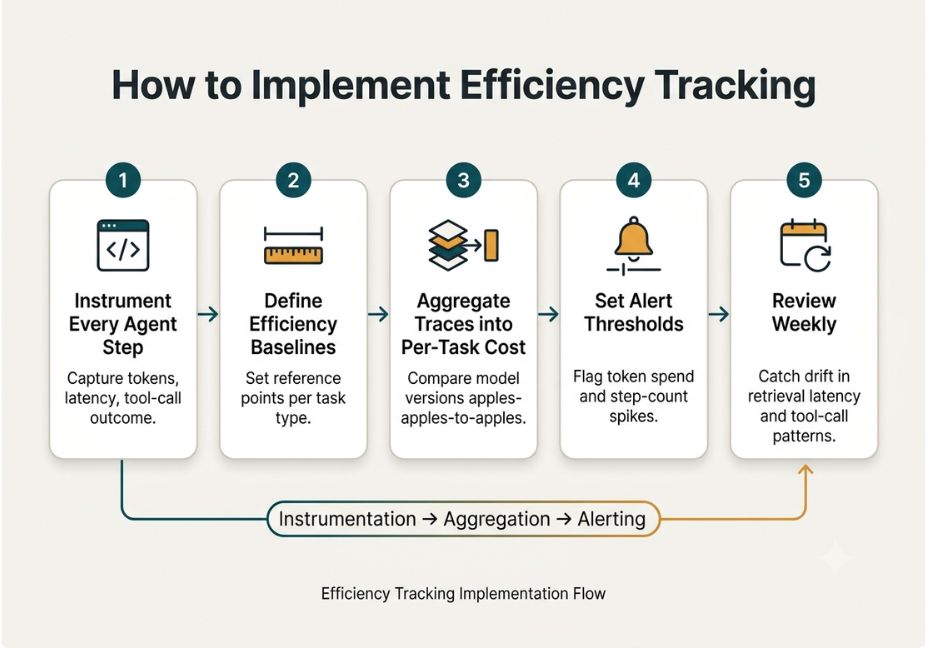
- First, instrument every agent step with spans that capture tokens, latency, and tool-call outcome not just the final response.
- Then, define efficiency baselines per task type before optimizing anything. Otherwise, you can’t detect a regression without a reference point.
- Next, aggregate traces into per-task cost so you can compare model versions or prompt changes on a like-for-like basis.
- In addition, set alert thresholds on token spend and step count, not just error rate.
- Finally, review weekly, since agent memory retrieval latency and tool-call patterns tend to drift as prompts and underlying models change.
Technical Disclaimer: Framework versions evolve rapidly. Code examples in this article reflect OpenTelemetry’s GenAI conventions and LangSmith/Langfuse APIs as of mid-2026. Always check the official docs for the current API surface.
Common Mistakes and How to Avoid Them
- Tracking accuracy but not cost. For example, a correct answer that took six redundant tool calls is still a regression.
- Ignoring trace-collection overhead. Some observability platforms add double-digit percentage latency, so it’s worth benchmarking before committing to production traffic.
- Treating every agent step the same. In reality, a retrieval call and a final generation call have very different cost profiles and need separate thresholds.
- Skipping the context window and chunking strategy audit. As a result, bloated context becomes one of the most common silent efficiency killers in RAG pipelines.
What Developers Are Saying
Discussion threads on r/LocalLLaMA and framework GitHub issue trackers consistently raise the same tension: teams want granular tracing detail for debugging, but every additional span adds latency in production. The practical consensus is to run verbose tracing in staging and a lighter-weight sampling strategy once an agent ships.
FAQ People Also Ask
What is the difference between AI agent monitoring and LLM observability?
LLM observability tracks individual prompt-response pairs latency, cost, and output quality for a single call. Agent monitoring extends this across an entire multi-step session, capturing tool calls, retrieval steps, and the causal chain between them.
How do you measure AI agent efficiency?
Measure token usage, tool-call count, and wall-clock latency per task, then compare against a defined baseline. Efficiency is a ratio: task success relative to resource cost, not resource cost alone.
What tools track AI agent performance in production?
LangSmith, Langfuse, AgentOps, and Arize Phoenix are the most widely used platforms, each offering trace instrumentation, dashboards, and alerting for production agent pipelines.
Can AI agents monitor their own efficiency?
Some platforms add an evaluation pipeline that scores traces automatically, but full self-monitoring is limited human-reviewed baselines are still needed to catch behavioral drift that automated scores miss.
Is Langfuse free to use?
Langfuse’s self-hosted deployment is free with no usage limits; its managed cloud offering has a free tier with usage caps before paid plans apply.
How do I know if my AI agent is running efficiently?
Check whether it’s completing tasks with the fewest necessary tool calls and tokens for a given accuracy level. If token usage or step count rises without a matching gain in accuracy, the agent has become less efficient.
What’s the easiest way to start tracking AI agent efficiency?
Start small: wrap your existing agent calls in OpenTelemetry-style spans, then send those traces to a free tier of LangSmith, Langfuse, or Arize Phoenix before committing to a paid platform.
Conclusion
In short, efficiency tracking using AI tools isn’t about installing another time-tracking dashboard. Rather, it’s about instrumenting the tool-use loop so token spend, latency, and cost-per-task become visible metrics instead of end-of-month surprises. To get started, instrument your traces first, then pick an observability platform that fits your framework, and finally treat efficiency as an evaluation dimension alongside accuracy. Bookmark this guide and explore more hands-on AI agent tutorials at agentiveaiagents.com.